📌 Why Email Benchmarks Matter in 2025
Email remains one of the highest-ROI channels in digital marketing—but performance varies significantly based on your industry, content, audience, and timing.
Tracking the right benchmarks helps you:
- Set realistic performance goals
- Identify campaigns underperforming in opens, clicks, or deliverability
- Improve audience engagement and list health
- Protect your sender reputation in light of 2025 spam filtering updates
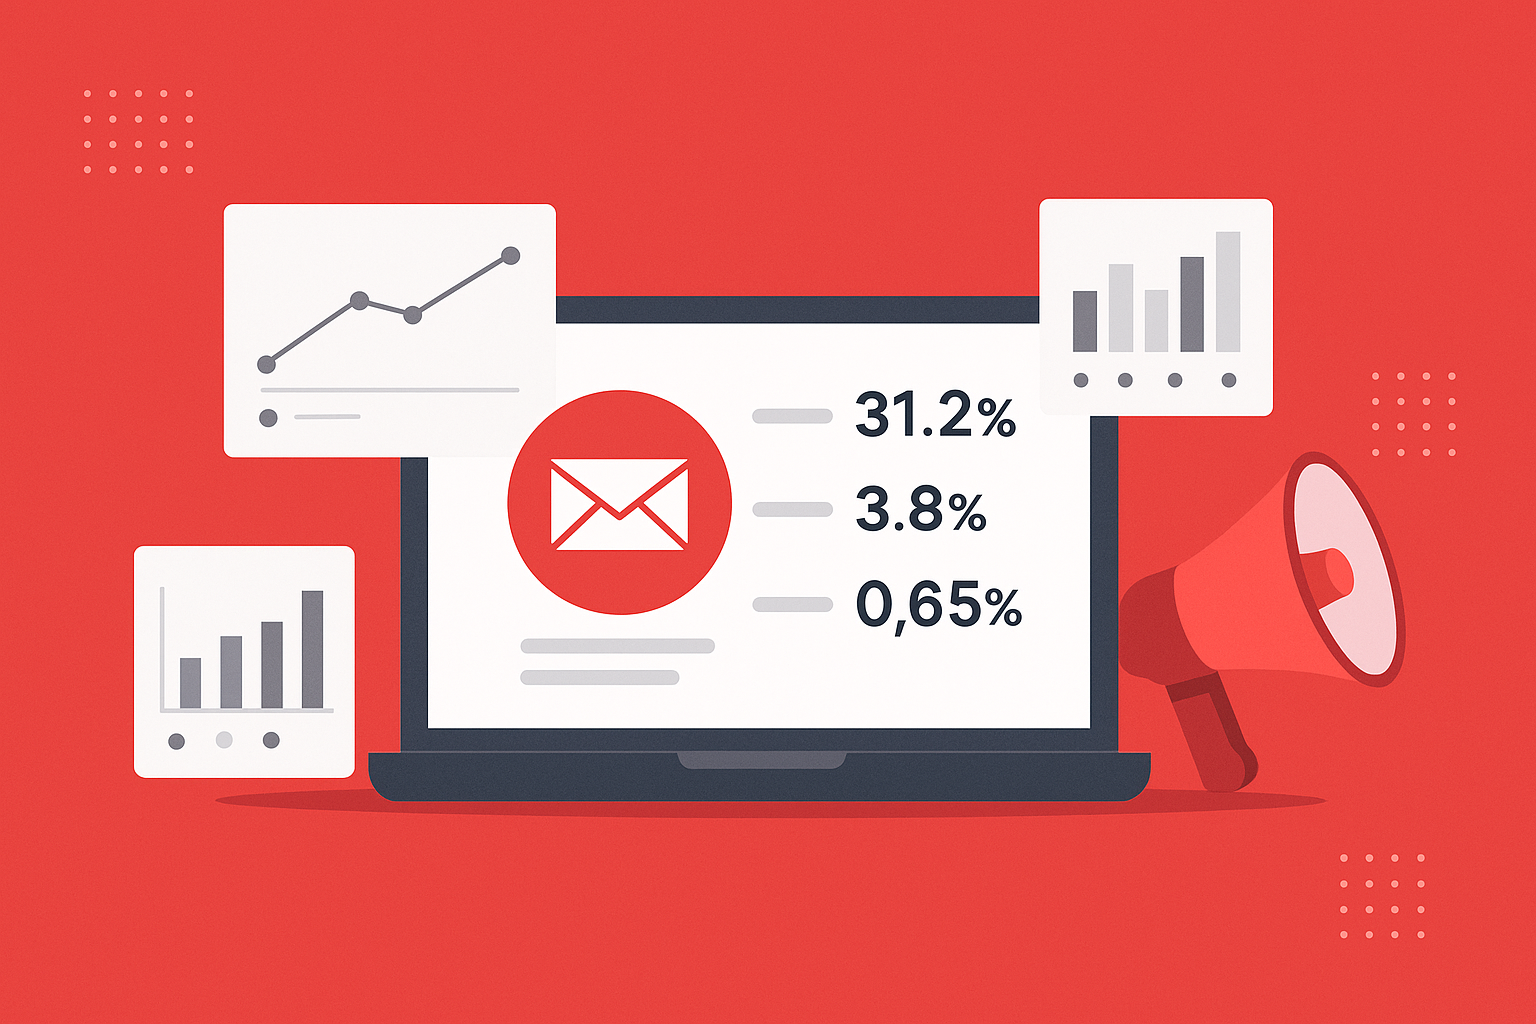
📬 Average Global Email Marketing Benchmarks (2025)
| Metric | 2025 Average |
|---|---|
| Open Rate | 31.2% |
| Click-Through Rate (CTR) | 3.8% |
| Click-to-Open Rate (CTOR) | 12.1% |
| Bounce Rate | 0.65% |
| Unsubscribe Rate | 0.17% |
🔍 Source: Aggregated from Campaign Monitor, Mailchimp, Moosend, HubSpot, Litmus, and InboxParrot client campaigns (Q1 2025).
📂 Average Open Rates by Industry (2025)
| Industry | Open Rate |
|---|---|
| Nonprofits | 38.4% |
| Education | 35.7% |
| B2B Services | 33.1% |
| Healthcare | 31.4% |
| SaaS / Tech | 29.2% |
| E-Commerce / Retail | 26.5% |
| Media & Publishing | 25.1% |
| Real Estate | 34.3% |
✅ Benchmark tip: If you’re consistently under 25%, audit subject lines, sender name, list quality, and domain health.
🔗 Click-Through Rate (CTR) Benchmarks by Industry
| Industry | CTR |
|---|---|
| B2B Services | 4.3% |
| SaaS / Tech | 4.1% |
| Education | 4.0% |
| Nonprofits | 3.9% |
| E-Commerce | 2.8% |
| Real Estate | 2.5% |
| Media & Newsletters | 2.4% |
🎯 Improve CTR by:
- Including 1 clear CTA per email
- Segmenting your audience
- Using buttons instead of plain links
⚠️ Bounce Rate & Unsubscribe Rate (2025)
| Type | Safe Range |
|---|---|
| Soft Bounce | < 1.0% |
| Hard Bounce | < 0.5% |
| Unsubscribe Rate | 0.1%–0.2% max |
🚨 High bounce/unsub rates?
- Clean your list every 30–60 days
- Use email warm-up tools like Warmy.io
- Use confirmed (double) opt-in
- Segment inactive users for a re-permission campaign
🔁 Benchmarks by Automated Email Flow (2025)
| Flow Type | Open Rate | Click Rate | Unsubscribe | Bounce Rate |
|---|---|---|---|---|
| Welcome / Onboarding | 58–70% | 12–22% | 0.1% | 0.2% |
| Activation / Education | 42–55% | 6–12% | 0.15% | 0.2% |
| Reactivation / Win-back | 28–45% | 4–8% | 0.3% | 0.4% |
| Transactional Emails | 85–90% | 5–12% | <0.05% | <0.1% |
💡 Action Tip: Welcome and onboarding emails consistently deliver the highest engagement. Make your first impression count.
📬 Benchmarks by Campaign Type (2025)
| Campaign Type | Open Rate | Click Rate | Unsubscribe | Bounce Rate |
|---|---|---|---|---|
| Newsletters | 30–42% | 4–6% | 0.15% | 0.3% |
| Promotional Emails | 20–32% | 2–4.5% | 0.2% | 0.4% |
| Event Invites | 25–38% | 4–8% | 0.18% | 0.25% |
| Surveys / Feedback | 25–35% | 6–10% | 0.12% | 0.2% |
🎯 Email Type Tip: Promo emails need urgency + strong visuals. Newsletters succeed with regularity and story-driven formatting.
🛠️ Best Tools to Track and Improve Email Metrics
| Tool | Why Use It |
|---|---|
| SendPulse | Real-time analytics, time zone sending, segmentation |
| ActiveCampaign | Behavioral automation + campaign scoring |
| Moosend | AI segmentation + eCommerce integrations |
| MailerLite | Great for testing subject lines + content blocks |
| Stripo | Design & export responsive email templates |
| Warmy.io | Protect inbox placement with AI warm-up |
📈 How to Benchmark Your Email Performance
- Compare your metrics to these 2025 benchmarks
- Segment by list type, campaign type, and goal
- Test subject lines (A/B) weekly
- Clean your list every 30–60 days
- Use smart workflows (SendPulse, ActiveCampaign) to scale what works
- Warm new domains before launch with tools like Warmy.io
🧠 Final Thoughts
Benchmarks aren’t the finish line—they’re the map.
Use them to set goals, spot outliers, and improve what matters most: user engagement and deliverability.
💌 Want help beating your industry averages? Reach out to InboxParrot—your expert partner in email automation, retention, and optimization – info@inboxparrot.com